

How Insulin Resistance Develops Before Diabetes
Understanding the Silent Progression That Affects Millions
Insulin resistance is developing silently right now in millions of people who feel perfectly fine. It's not a condition that announces itself with dramatic symptoms. Instead, it's a quiet metabolic failure that progresses for 10 to 20 years before you're likely to notice anything wrong. By the time someone receives a type 2 diabetes diagnosis, their body has often been struggling with glucose control for more than two decades.1 The crucial insight; understanding how it develops, explains why early detection and intervention can literally save your future health.
This isn't rare. 40% of young American adults (ages 18-44) have insulin resistance, and roughly 97-115 million Americans have pre-diabetes. Yet 8 out of 10 people with these conditions don't know they have them.2 What makes this situation urgent is that insulin resistance is completely reversible in its early stages, but only if you catch it before permanent damage accumulates in your pancreas.
What Insulin Is and Why It Matters
Before understanding what goes wrong, you need to understand how the system normally works. Your body runs on glucose, a simple sugar extracted from food. Glucose is fuel, and your cells burn it for energy throughout the day. But glucose can't simply float into your cells on its own. It needs insulin, a hormone produced by your pancreas, to act like a key that unlocks your cells' doors.
In healthy people, this system is remarkably precise. When you eat a meal with carbohydrates, your blood glucose rises within minutes. Your pancreas detects this rise and releases insulin. The insulin binds to insulin receptors on your muscle, fat, and liver cells, triggering a cascade of signals that moves glucose transporters (specifically GLUT4 proteins) to the cell surface. Glucose flows in, blood sugar drops, and your pancreas stops releasing insulin. The whole cycle takes 2 to 3 hours and maintains blood glucose in a tight range of 70 to 140 mg/dL.3 Your brain never consciously makes this happen; it's automatic regulation that works hundreds of times per day.
The system is elegant because it's redundant. A healthy pancreas produces 30 to 50 units of insulin daily but stores about 200 units. If one regulatory mechanism fails, backup systems activate. This explains why diabetes doesn't develop suddenly; it develops when multiple systems fail simultaneously, and your pancreas can no longer compensate.
How the System Starts to Fail: The First Domino Falls
Insulin resistance begins when cells stop responding normally to insulin. Instead of acting as a key that easily unlocks cells, insulin becomes less effective. Think of it as the lock starting to jam. Your cells still technically have insulin receptors, but the signalling cascade that should trigger glucose entry becomes impaired.
At the cellular level, multiple mechanisms cause this dysfunction simultaneously.4
Lipid Accumulation Inside Cells: When you consume excess calories, especially from refined carbohydrates and added sugars, your body stores excess energy as fat, not just in subcutaneous tissue (under your skin), but inside your muscle and liver cells themselves. This intracellular fat takes specific forms: triglycerides, fatty acyl-CoA, diacylglycerol (DAG), and ceramides. These lipids directly interfere with insulin signalling by blocking the phosphorylation of insulin receptor substrates (IRS-1), preventing the cascade from propagating. It's like putting sand in the gears of a machine.
Visceral Fat and Inflammation: Not all body fat is equal. Visceral fat, the inflammation-prone fat surrounding your organs, is metabolically active inflammatory tissue. When visceral fat cells expand beyond their normal capacity, they recruit immune cells called macrophages. These macrophages release inflammatory cytokines: TNF-alpha, IL-6, IL-8, and others. These cytokines activate a molecular alarm system called the NLRP3 inflammasome, which releases IL-1 beta, a potent driver of insulin resistance. Additionally, visceral fat drains directly into your liver via the portal vein, bathing your liver in free fatty acids and inflammatory molecules, causing fatty liver disease and hepatic insulin resistance.5
Mitochondrial Dysfunction: Your mitochondria are your cells' energy factories. When mitochondrial function deteriorates (due to high-fat diet, oxidative stress, or metabolic overload), two destructive things happen simultaneously. First, your cells produce energy inefficiently, leading to chronically low ATP (cellular energy). Second, dysfunctional mitochondria overproduce reactive oxygen species (ROS), damaging free radicals that trigger inflammatory pathways. The JNK pathway, activated by excess ROS, phosphorylates IRS-1 at the wrong location (serine 307 instead of tyrosine), essentially breaking the insulin signalling cascade.
Endoplasmic Reticulum Stress: Your endoplasmic reticulum is your cell's protein-folding factory. When you consume a high-fat diet or experience oxidative stress, unfolded proteins accumulate. This triggers an "unfolded protein response" that activates a protein called TRB3. TRB3 blocks phosphorylation of both AKT and IRS-1, disabling multiple steps of insulin signalling. Additionally, ER stress prevents newly synthesized insulin receptors from reaching the cell surface, meaning cells literally can't "see" circulating insulin.
All these mechanisms converge on one outcome: impaired GLUT4 glucose transporter trafficking. Regardless of which mechanism triggered insulin resistance, they all prevent glucose transporters from reaching the cell surface where they can do their job. Without GLUT4 transporters exposed on the cell surface, glucose cannot enter muscle and fat cells efficiently, even when insulin levels are high.
The Dietary Accelerant: How Sugar Drives Rapid Deterioration
Your dietary choices directly impact how quickly insulin resistance develops at the cellular level. This isn't about calories being equal; it's about specific nutrients causing specific metabolic damage.
High-fructose corn syrup (HFCS) and added sugars create rapid cellular changes. Within just 2 weeks of consuming sweetened beverages, detectable increases in liver fat and decreases in insulin sensitivity occur.6 This speed demonstrates how quickly dietary choice impacts cellular function.
The mechanism is straightforward. Your liver metabolises fructose differently than glucose. Unlike glucose, which is tightly regulated, fructose undergoes 'unregulated uptake' in the liver. Your liver then manufactures fat from this sugar through a process called de novo lipogenesis. Additionally, concentrated fructose loads deplete ATP in liver cells, directly impairing insulin receptor function. The process also induces oxidative stress, mitochondrial dysfunction, endoplasmic reticulum stress, and impaired calcium signalling. Perhaps most tellingly, lactate accumulation (a fructose byproduct) explains approximately 71% of HFCS's effect on insulin sensitivity, showing how fundamentally this sugar alters your metabolic machinery.
Regular sugar (sucrose, which is 50% glucose and 50% fructose) causes similar damage. Refined carbohydrates without added sugar still contribute by causing rapid blood glucose elevation, excessive insulin secretion, and chronically elevated insulin levels. Over time, cells become desensitised to constant insulin exposure, like hearing an alarm all day until you stop responding to it.
The Progression Timeline: Years of Silent Development
This is the critical piece most people misunderstand: insulin resistance develops silently for 10 to 20 years (sometimes longer) before symptoms appear or a diabetes diagnosis occurs.1
The timeline typically unfolds as follows:
Years 0 to 5: Early Insulin Resistance (The Silent Phase) Cellular insulin resistance begins at the level you've just read about. Your cells stop responding normally to insulin, but your pancreas detects the problem and compensates by producing more insulin. Your fasting insulin levels may be rising, but your blood glucose remains normal because your pancreas is working overtime. You feel fine. Your standard blood tests look normal. This phase can last many years without being detected.
Years 5 to 15: Pre-Diabetes Emerges (The Compensation Limit) After approximately 5 to 15 years of this compensation, your pancreatic beta cells begin struggling to keep up. Your fasting glucose rises to 100-125 mg/dL (the pre-diabetes range). Your HbA1c (average glucose over three months) reaches 5.7% to 6.4%. The first-phase insulin response after eating is lost, meaning your pancreas can no longer mount that immediate insulin spike. Your beta-cell volume shows approximately a 40% deficit. Yet at this stage, you may still feel normal. Most people with pre-diabetes experience no symptoms whatsoever.7
Years 15 to 20+: Beta-Cell Failure and Type 2 Diabetes Eventually, your pancreas can no longer produce enough insulin to overcome the cellular resistance. Beta-cells show functional deterioration, and the beta-cell mass itself declines. Fasting hyperglycaemia develops (your glucose stays elevated all day). Your HbA1c rises above 6.5%, meeting the diagnostic criteria for type 2 diabetes. Insulin secretion becomes inadequate despite the overwhelming demand.
The critical insight: diabetes may actually start developing as much as 10 years before pre-diabetes appears, meaning 20+ years before a diabetes diagnosis in many patients.1 This long timeline is not bad news; it's opportunity. You have years, potentially decades, to intervene before permanent damage occurs.
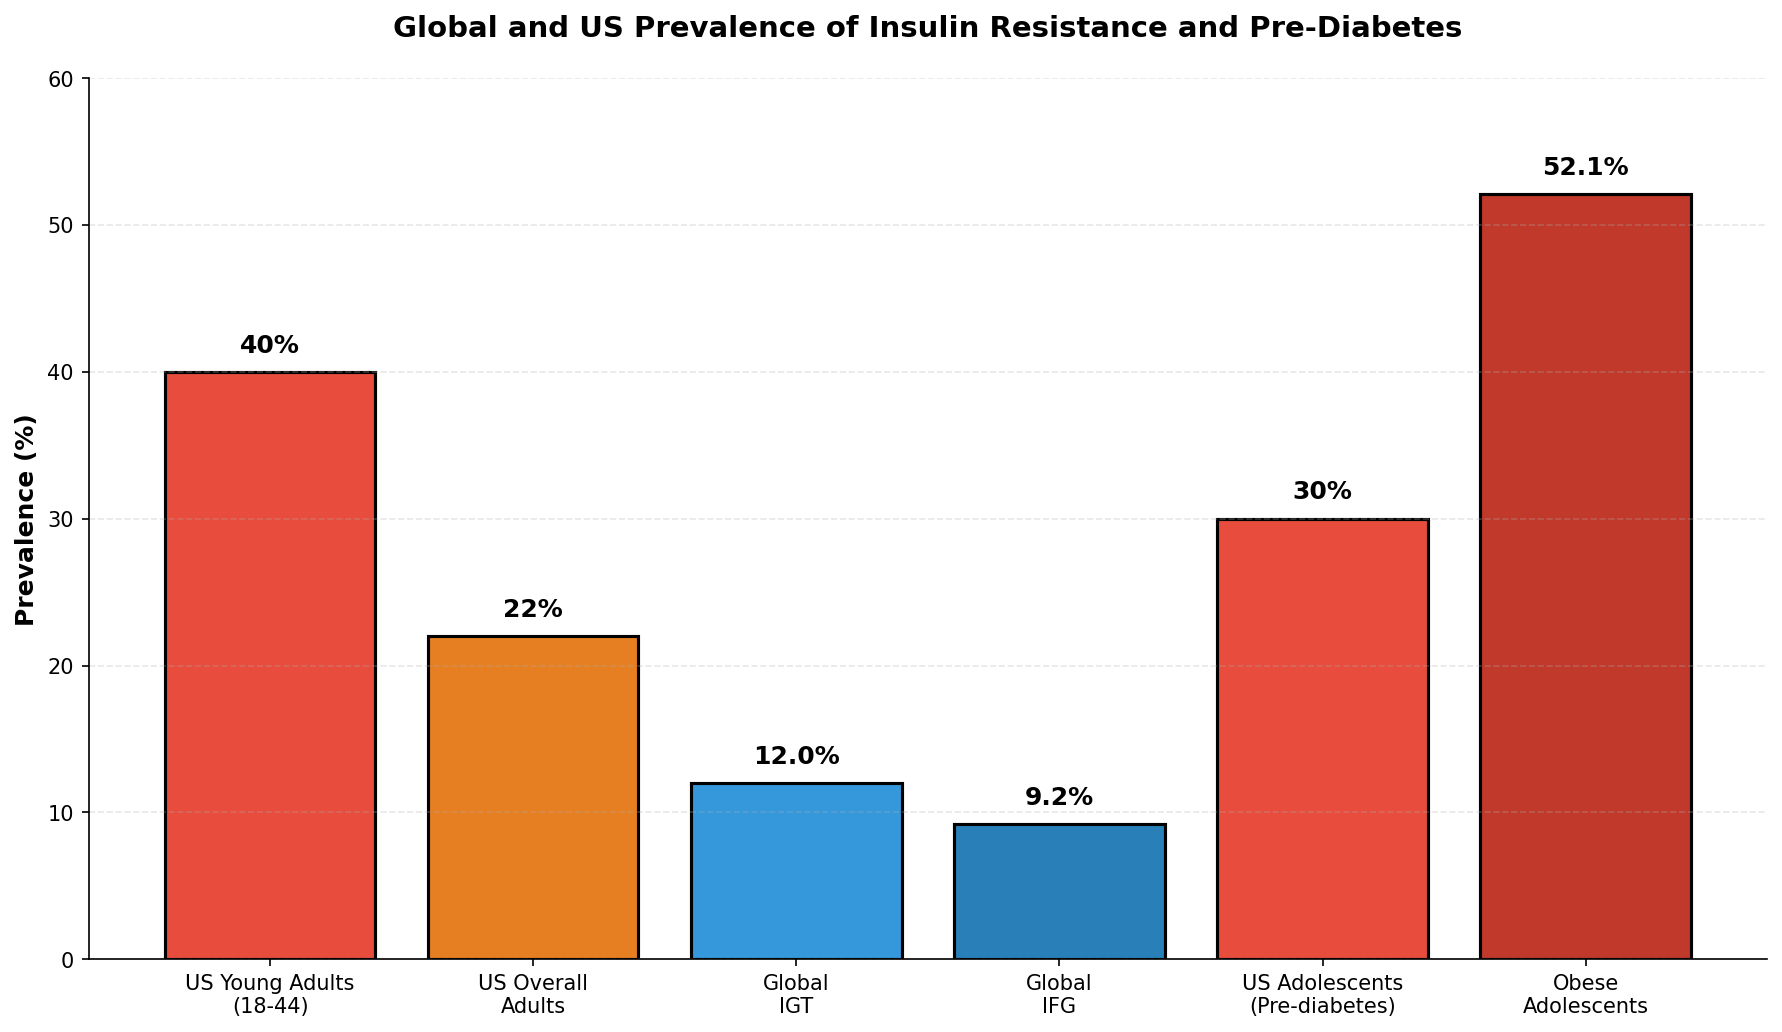 Figure 1: Global prevalence showing how widespread insulin resistance and pre-diabetes have become.2
The Pancreas Story: Compensation and Eventual Failure
Your pancreas contains approximately 1 to 2 million tiny clusters of cells called islets. The beta-cells within these islets are insulin-producing specialists. When insulin resistance develops, something remarkable happens: your beta-cells initially adapt by working harder. They increase insulin production by 2 to 3 times normal levels. This hyperinsulinaemia maintains relatively normal blood glucose for years by sheer force of will, so to speak.
But this adaptation comes at a cost. Chronically elevated insulin production causes multiple stresses on beta-cells. Excessive insulin production causes the accumulation of unfolded proteins in the endoplasmic reticulum, triggering cellular stress responses. The high metabolic demand generates excess free radicals that damage beta-cell machinery. Elevated free fatty acids accumulate inside beta-cells and impair their function. As blood glucose begins to rise, it further damages beta-cells through oxidative stress and glycotoxicity. Mitochondrial dysfunction within beta-cells deteriorates their ability to generate ATP for insulin production.
Critically, beta-cell dysfunction is not immediately reversible if it has progressed too far. Early in the insulin resistance stage, beta-cell dysfunction can be reversed through weight loss and lifestyle change. More advanced beta-cell loss and dysfunction may be permanent. This is why catching insulin resistance early (before pre-diabetes diagnosis) is critical. The longer insulin resistance persists unchecked, the more irreversible beta-cell damage accumulates. The window to reverse damage whilst maintaining normal glucose control is your intervention window.
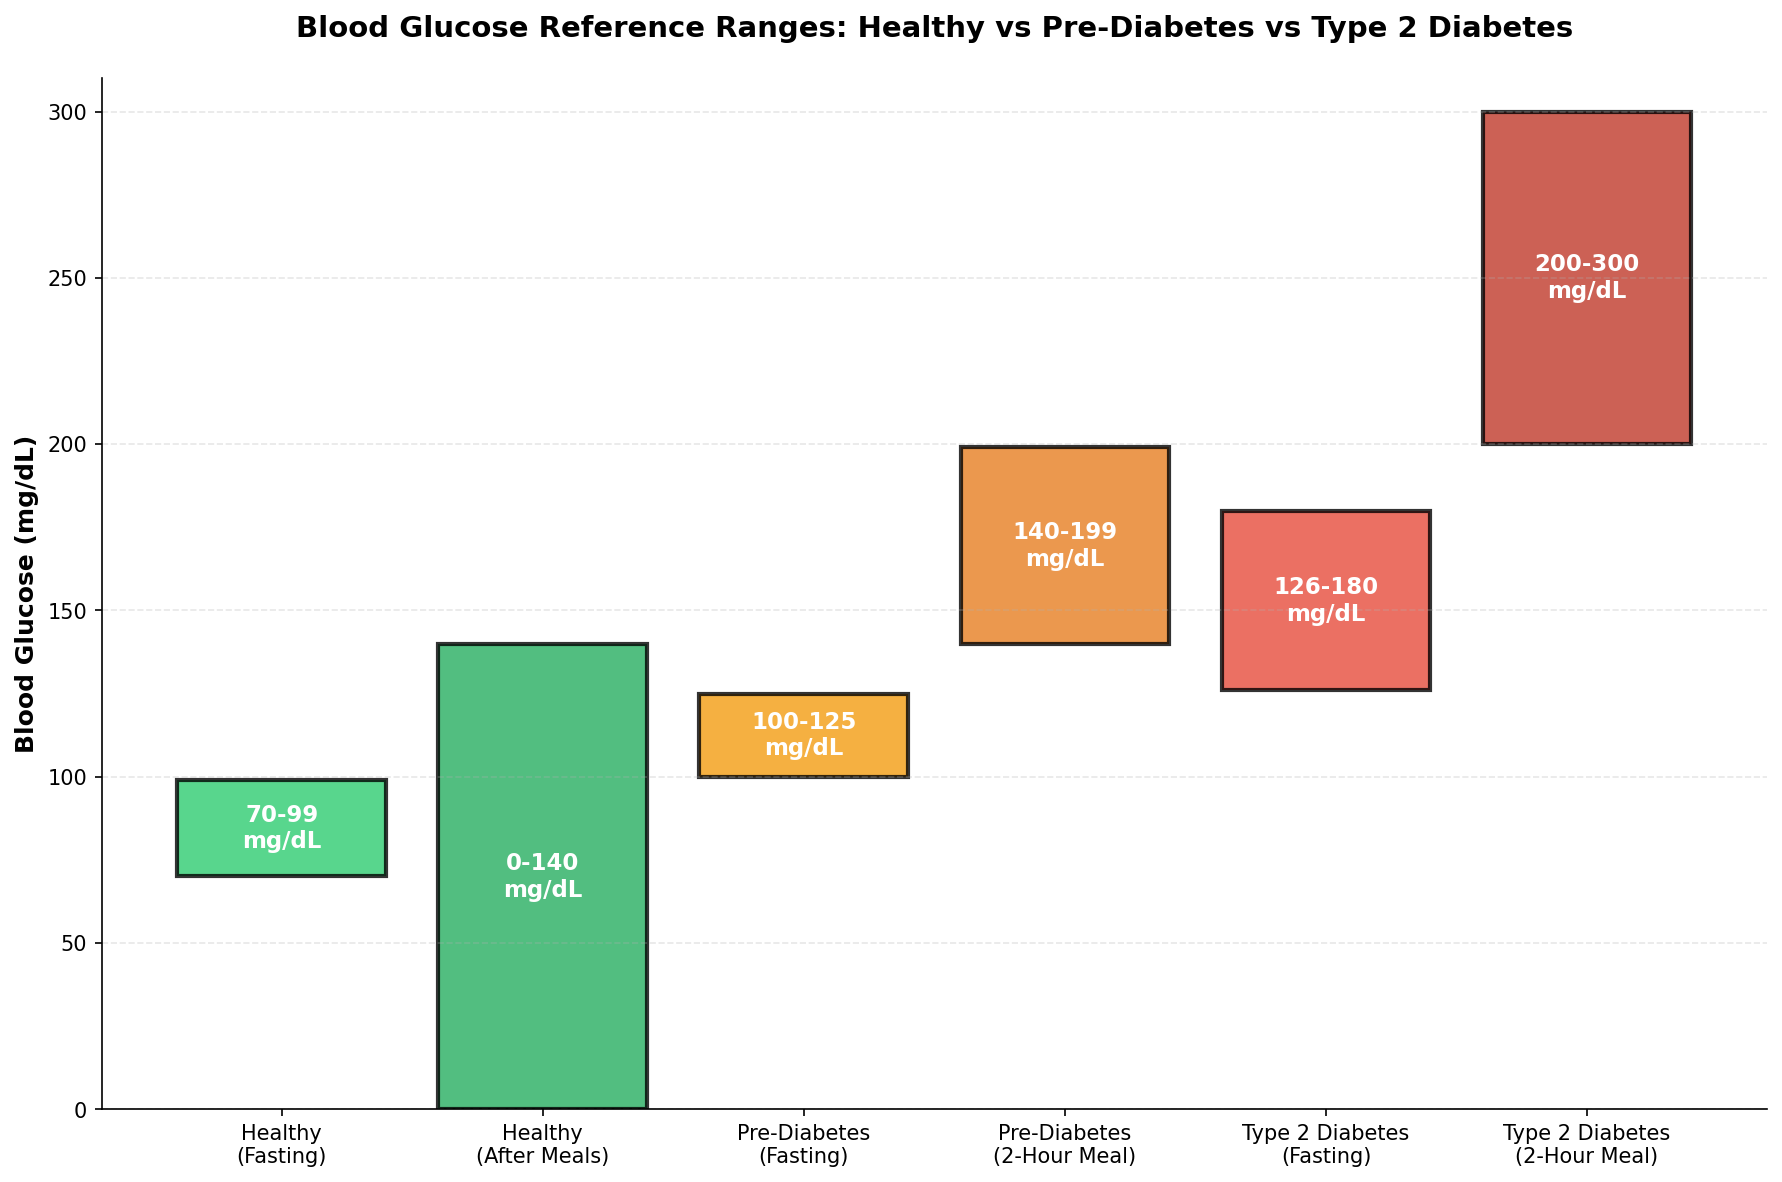 Figure 2: Blood glucose measurement ranges across the spectrum from normal glucose tolerance through pre-diabetes to type 2 diabetes.3
Genetic Predisposition: Your Starting Point
Not everyone develops insulin resistance at the same rate. Your genes load the gun; your lifestyle pulls the trigger. At least 150 different DNA variations are associated with insulin resistance and type 2 diabetes risk. However, these common genetic variants account for only 25% to 44% of the heritability of insulin resistance, meaning environment and lifestyle choices matter enormously.8
Three genes have been identified as particularly important. The TCF7L2 gene is the strongest known genetic risk factor for type 2 diabetes. It controls insulin production and secretion in the pancreas; when mutated, your pancreas struggles to make enough insulin when you need it. The FTO gene is often called the "obesity gene" because variations increase the likelihood of weight gain, which directly triggers insulin resistance. The PPARG gene controls fat cell development and glucose metabolism; mutations make it harder for your cells to accept insulin.
If you have a family history of diabetes or obesity, you're at a higher baseline risk. But genetic predisposition is like having a vulnerability; it requires the right environmental conditions to activate. Many people with genetic risk factors never develop insulin resistance if they maintain a healthy weight and physical activity. Conversely, people without obvious genetic risk can develop insulin resistance through poor lifestyle choices.
The Age Factor and Population Differences
Insulin resistance isn't exclusive to older people, though risk increases significantly over age 45. Nearly 1 in 3 American teenagers now have pre-diabetes (30%), a concerning expansion into younger populations driven by obesity and sedentary lifestyle.2 In the United States, 52.1% of people aged 65 and older have pre-diabetes, and the prevalence is nearly universal (approaching 100%) in people with obesity.
Certain ethnic groups have higher genetic predisposition and currently higher prevalence rates, including Hispanic, African American, Native American, and Asian American populations. This isn't because of genetic determinism; it reflects complex interactions between genetic susceptibility and socioeconomic factors affecting diet and physical activity access.
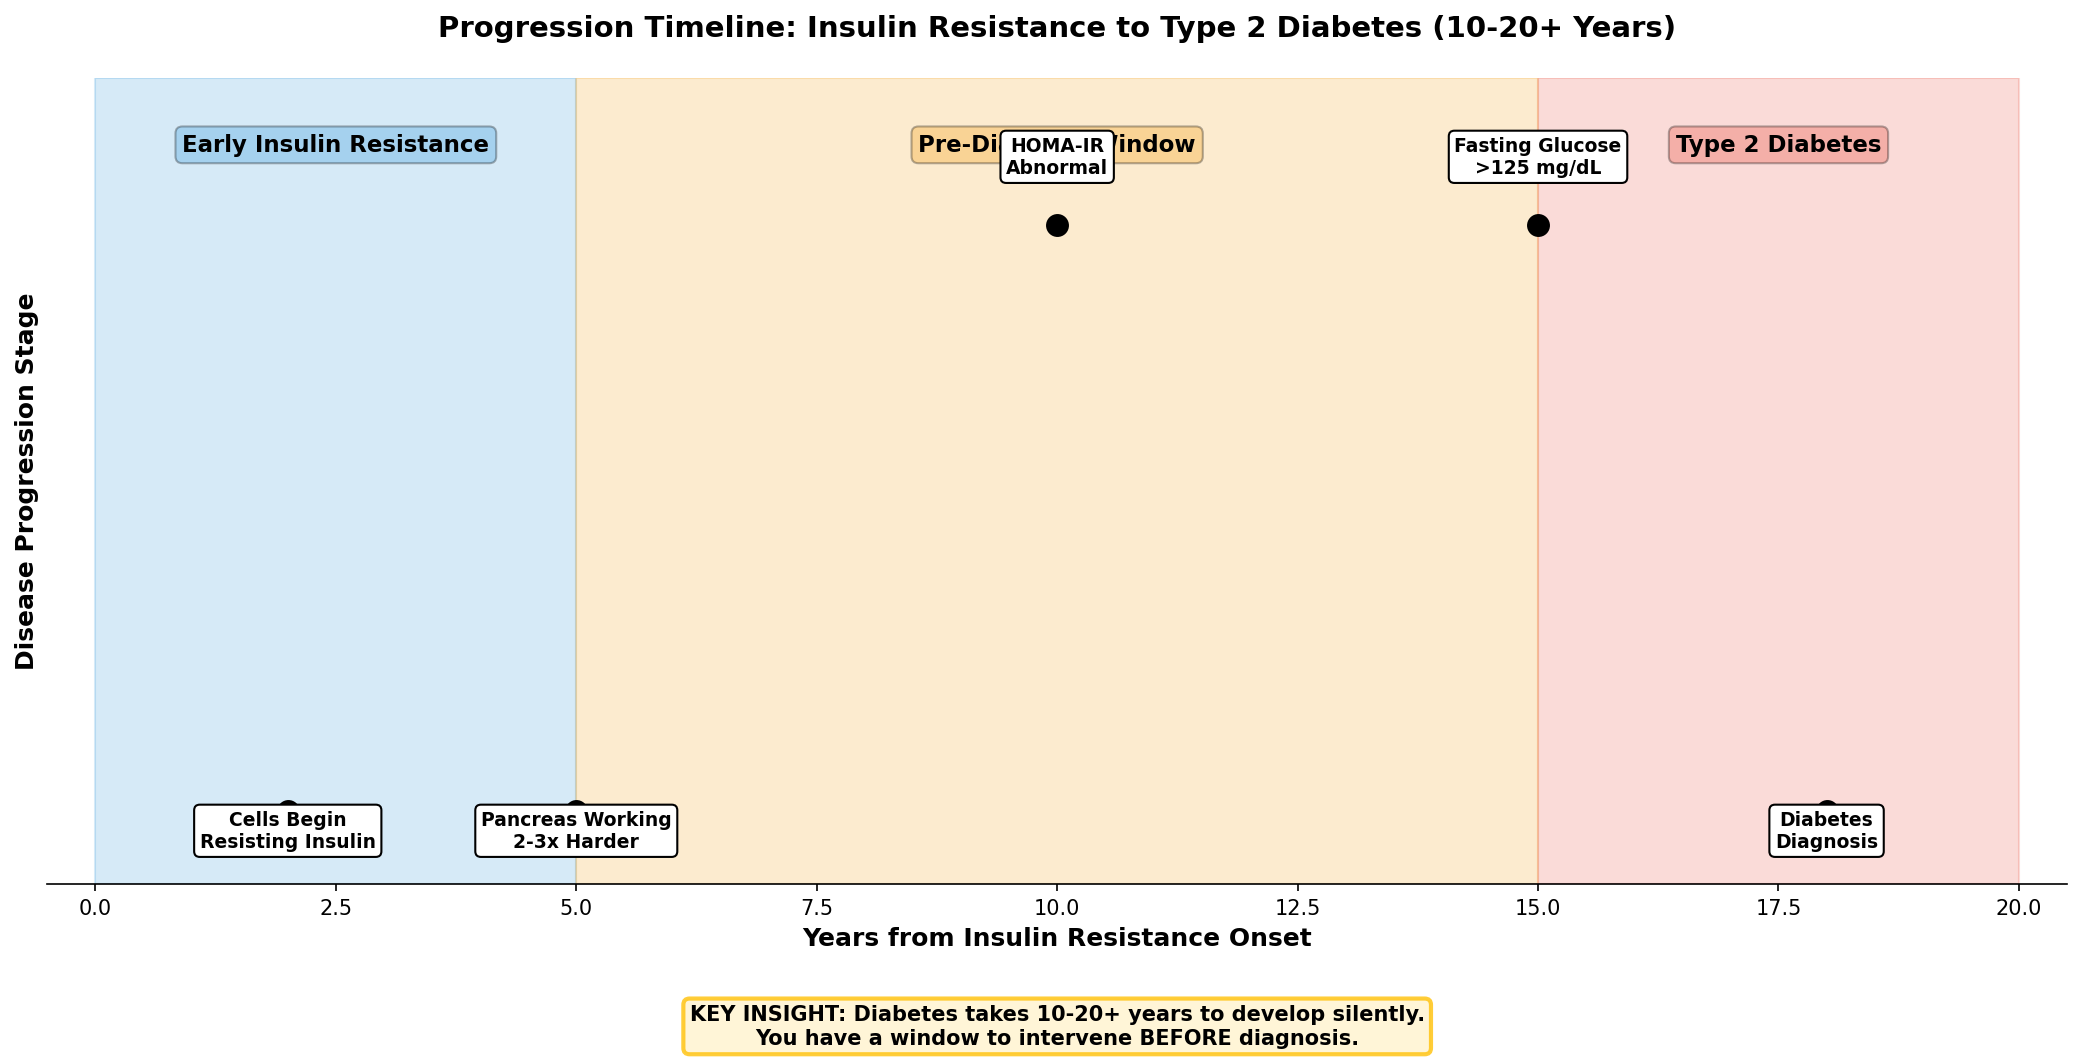 Figure 3: The timeline showing how long insulin resistance develops silently before diagnosis, emphasising the critical intervention window.1
Detecting Insulin Resistance: Why Standard Tests Miss It
Here's what creates the detection crisis: fasting glucose and HbA1c often become abnormal only after significant metabolic damage has already occurred. By the time these markers show pre-diabetes, you may have already had insulin resistance for several years.
Advanced metabolic markers can identify insulin resistance years before standard pre-diabetes diagnosis. Fasting insulin level measures how much insulin your pancreas produces at rest. Optimal fasting insulin is less than 8 mIU/L, suggesting good insulin sensitivity. However, 8 to 10 mIU/L suggests possible early insulin resistance, and 10 to 12 mIU/L or higher indicates likely insulin resistance. This marker can be elevated years before glucose becomes abnormal, making it valuable for early detection.
HOMA-IR (Homeostasis Model Assessment of Insulin Resistance) is calculated from fasting glucose multiplied by fasting insulin, divided by 405. A HOMA-IR below 1.0 indicates optimal insulin sensitivity. Values of 1.0 to 1.9 suggest possible early insulin resistance, 2.0 to 2.9 suggest likely moderate insulin resistance, and values above 3.0 suggest likely significant insulin resistance. HOMA-IR is superior to fasting insulin alone because it accounts for both glucose and insulin levels and can identify insulin resistance even when fasting glucose is still "normal."
Triglyceride/HDL cholesterol ratio is another window into insulin resistance. Insulin-resistant people typically have high triglycerides and low HDL cholesterol. A ratio of 3.0 or higher in overweight individuals may indicate insulin resistance. This indirect marker is important because insulin resistance creates a specific lipid pattern.
Three standard blood tests define pre-diabetes. Fasting glucose of 100 to 125 mg/dL indicates impaired fasting glucose (normal is below 100 mg/dL; diabetes is 126 mg/dL or higher). HbA1c of 5.7% to 6.4% indicates prediabetes (normal below 5.7%; diabetes 6.5% or higher). This test reflects average glucose over two to three months. Two-hour postprandial glucose (measured 2 hours after eating a standardised meal) of 140 to 199 mg/dL indicates impaired glucose tolerance (normal below 140 mg/dL; diabetes 200 mg/dL or higher). Different tests catch different people, so a comprehensive assessment is valuable.
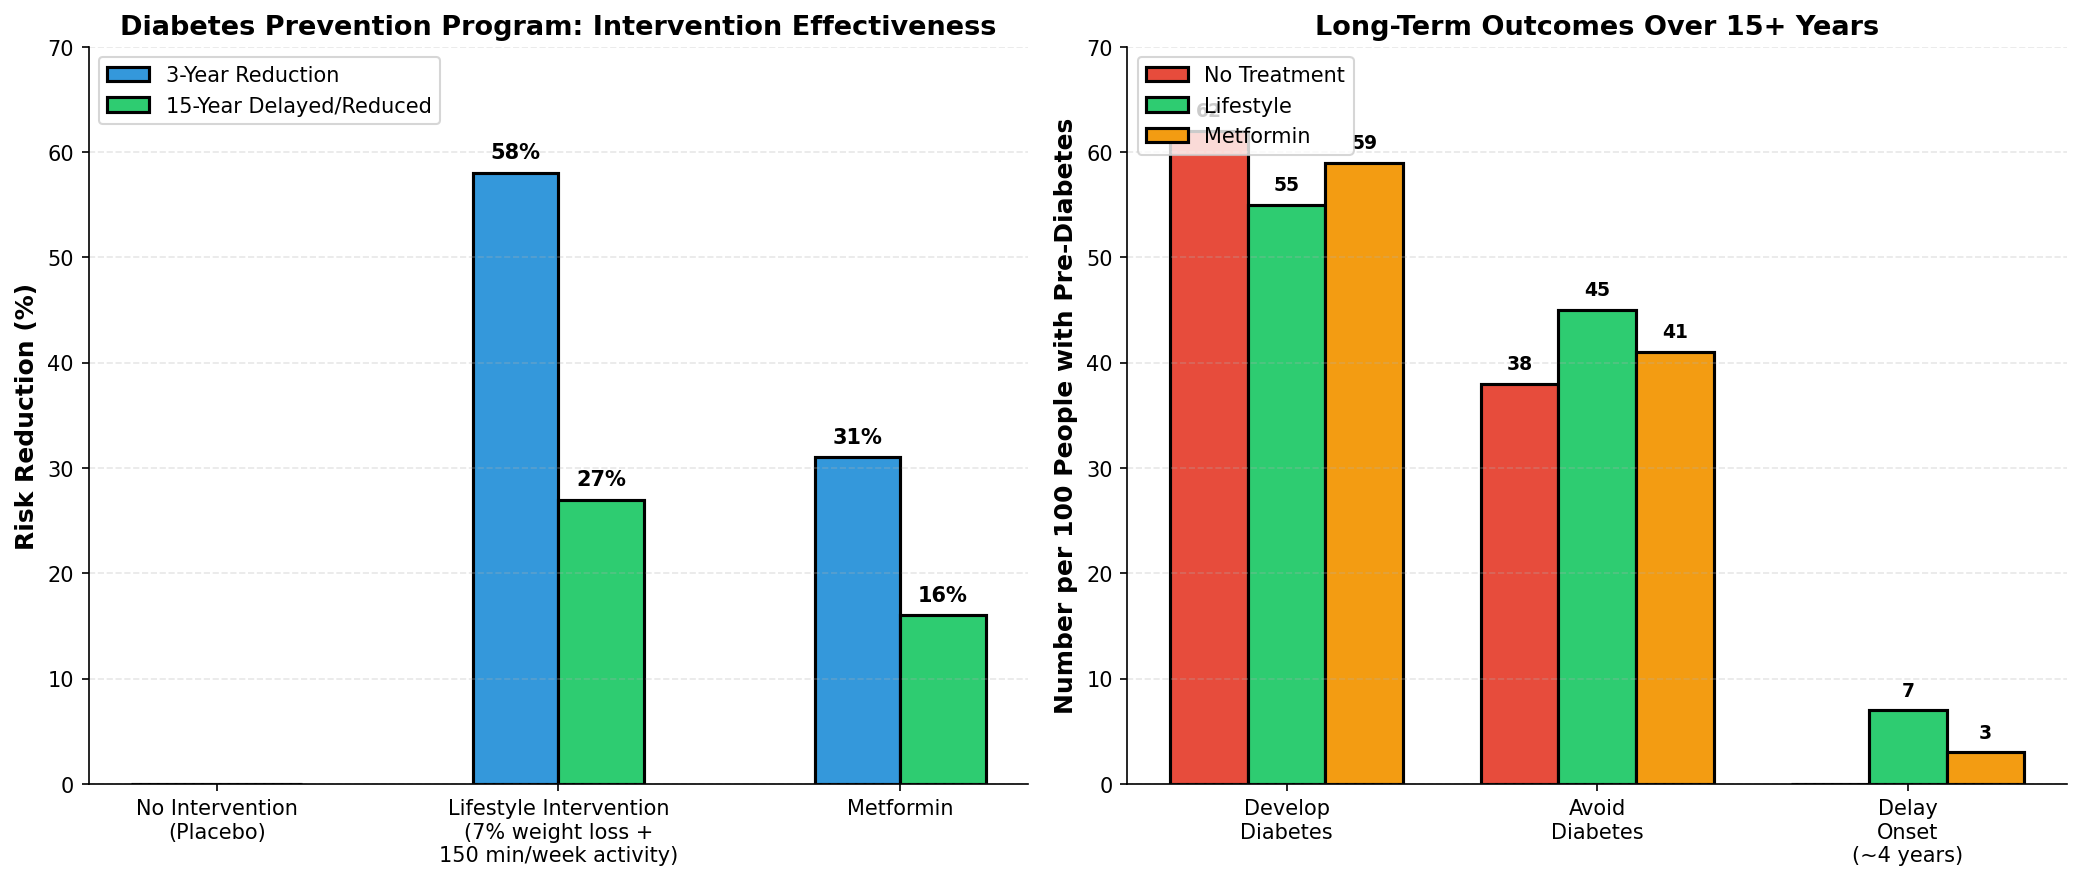 Figure 4: Diagnostic markers that show progression from normal glucose control to insulin resistance to pre-diabetes, including the advanced markers that catch problems early.3
The Critical Window of Reversibility: Evidence from the Diabetes Prevention Program
Here's where the story becomes profoundly encouraging. Insulin resistance and pre-diabetes are reversible, but only if you intervene early enough. The Diabetes Prevention Program (DPP), the largest and longest-running intervention study on pre-diabetes, demonstrated this conclusively.
The DPP enrolled 3,234 people with pre-diabetes and followed them for over 21 years. The lifestyle intervention group received individual coaching with a specific goal: 7% body weight loss and 150 minutes per week of physical activity (equivalent to brisk walking). The results were remarkable.
In the initial 3 years, the lifestyle intervention group experienced a 58% reduction in diabetes incidence. Participants who achieved 7% weight loss reduced diabetes risk by 58%. Even modest weight loss of 5% to 7% produced measurable metabolic benefits. This wasn't from medication; it was from behavioural change.9
The long-term follow-up is even more striking. At 15 years, the lifestyle intervention group had achieved a 27% reduction in diabetes incidence compared to the control group. The cumulative incidence was 55% in the lifestyle group versus 62% in placebo. Importantly, type 2 diabetes was delayed by approximately 4 years in those who received intervention versus controls. This means some people with pre-diabetes and early insulin resistance, when treated, never develop diabetes during their lifetime observation period.
Over 21 years of follow-up, the lifestyle group achieved a 24% cumulative diabetes reduction, with a median increase in diabetes-free survival of 3.5 years per person. This translates to real human terms: if you had 100 people with pre-diabetes, about 7 would avoid diabetes entirely through lifestyle change, and those who did eventually develop diabetes would live years longer without the disease.
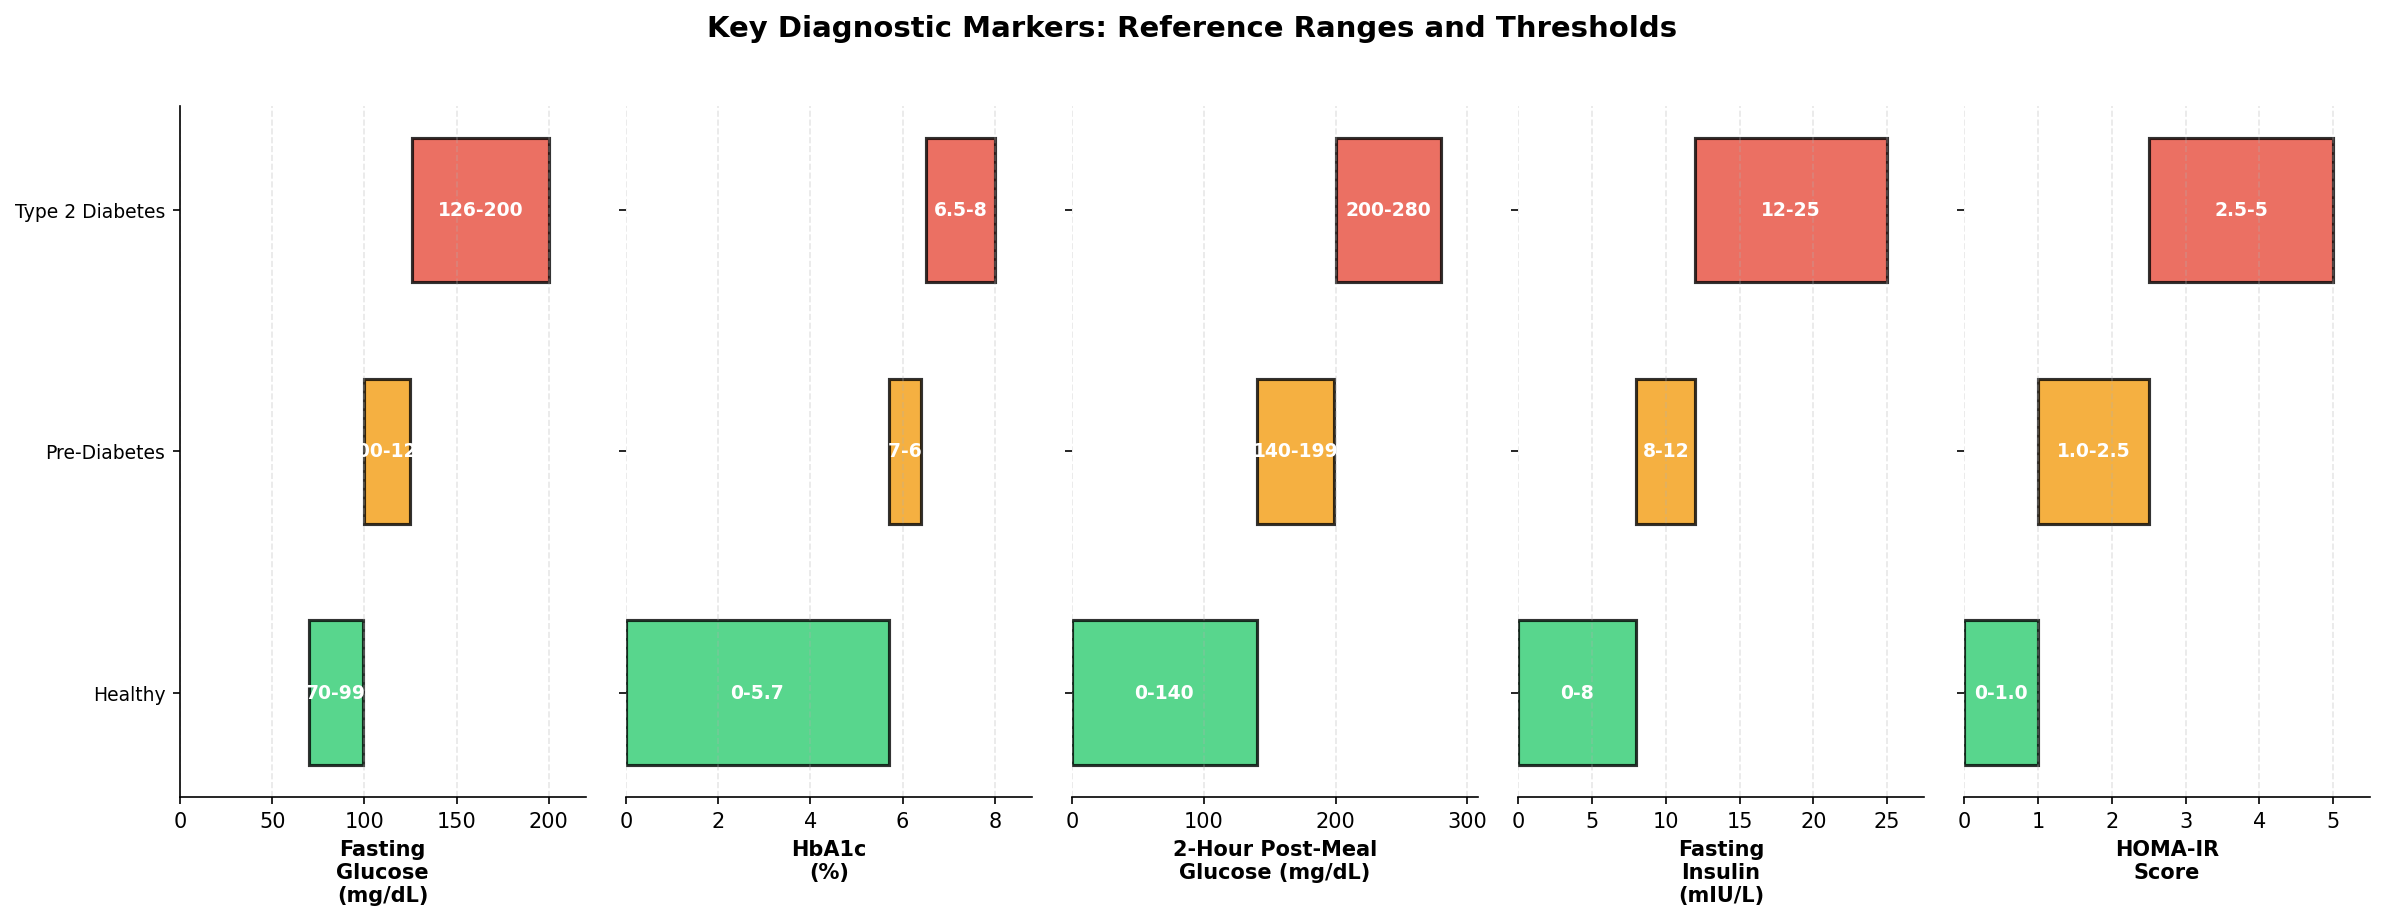 Figure 4: The Diabetes Prevention Program results demonstrating that 58% of diabetes cases can be prevented or delayed through lifestyle intervention.9
More recent 2024–2025 research has revealed something even more promising: achieving pre-diabetes remission (returning to normal glucose levels) is more effective at preventing type 2 diabetes than weight loss alone. Pre-diabetes remission means achieving normal glucose tolerance again (HbA1c below 5.7%). The breakthrough is that remission can be achieved even without substantial weight loss, or sometimes even with some weight gain. This shows the metabolic dysfunction can be reversed through intervention independent of scale weight.
When people achieved both 7% weight loss and prediabetes remission, they experienced a 76% reduction in relative risk of developing type 2 diabetes within 6 years. Those who achieved both: less than 1% developed type 2 diabetes after 4 years. This exceptional result shows that reversing the metabolic dysfunction, not just losing weight, is the key to preventing diabetes.
Progression Risk Stratification: Who Progresses Fastest
Not all people with pre-diabetes are at equal risk. When stratified by risk factors, progression rates vary dramatically. Low-risk groups have a 10-year progression rate of approximately 5.9% to diabetes. Intermediate-risk groups progress at 18.5% over 10 years. High-risk groups progress at 40.1% over 10 years.
Factors that accelerate progression include higher HbA1c at baseline (closer to the diabetes range), elevated fasting glucose, higher HOMA-IR (severe insulin resistance), significant obesity (particularly with abdominal distribution), completely sedentary lifestyle, family history of diabetes, age over 45, and belonging to higher-risk ethnic groups.10
What's important to understand is that progression is not rapid in most people. The average progression is slow enough that lifestyle intervention has time to work. You typically don't progress from pre-diabetes to diabetes within months. A window of 5 to 10 years is common before diabetes develops, though some progress faster.
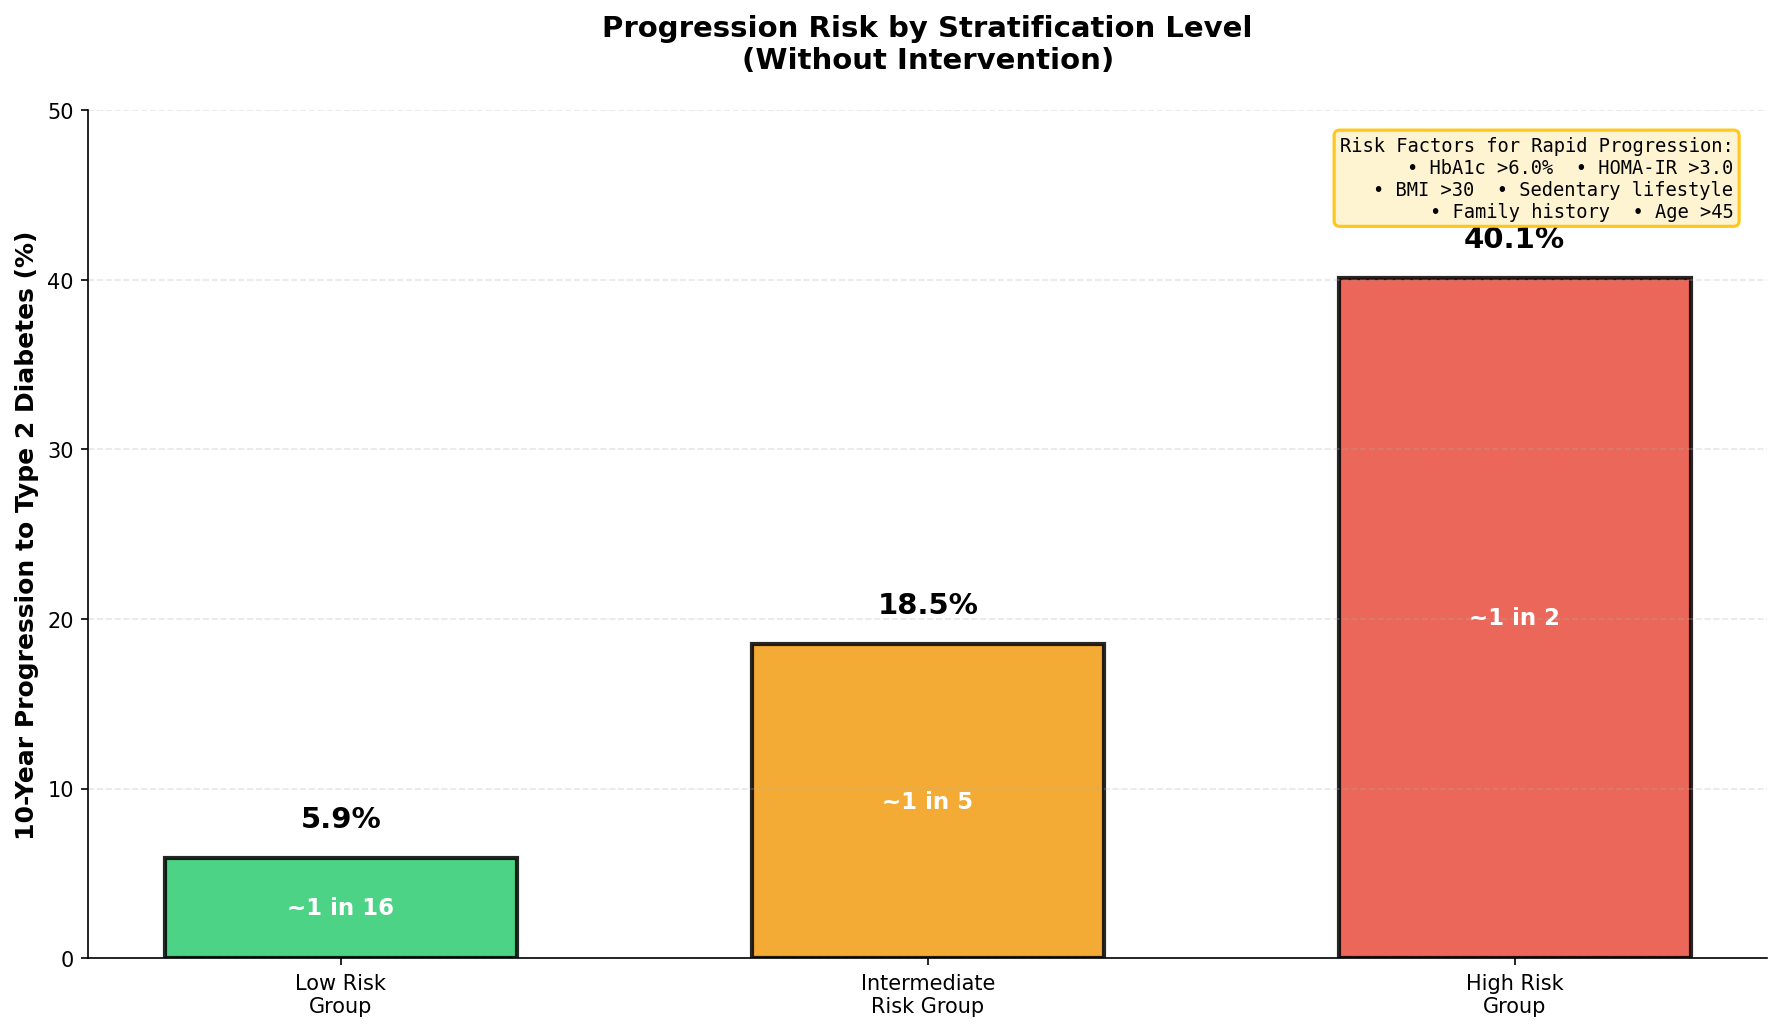 Figure 6: Risk stratification showing that not everyone with pre-diabetes progresses at the same rate, demonstrating the importance of personalised intervention based on baseline risk.10
Understanding the Mechanisms That Make Reversal Possible
Why is insulin resistance reversible? Because it's not permanent tissue damage. It's a convergence of dysfunctional processes, most of which can be restored with the right interventions. Let's examine how different interventions address multiple mechanisms simultaneously.
Weight loss, especially visceral fat reduction, removes the inflammatory trigger. Less visceral fat means fewer inflammatory cytokines being released. The liver is no longer bathed in metabolic toxins. Adiponectin production (a protective hormone) can increase. The inflammatory cascade quiets.
Exercise opens alternate glucose pathways. Muscle contraction itself triggers GLUT4 translocation independent of insulin (through AMP-activated protein kinase). This means during and after exercise, glucose enters muscle cells without needing insulin at all. Consistent exercise increases mitochondrial density and function, improving cellular energy production and reducing ROS. Exercise increases muscle mass, expanding your body's glucose disposal capacity. The anti-inflammatory effects of regular exercise suppress inflammatory cytokine production.
Dietary changes, particularly eliminating HFCS and refined carbohydrates, stop the acute cellular damage. Without constant fructose loads, your liver can use ATP for proper cellular function instead of depleting it. Oxidative stress decreases. ER stress resolves as dietary toxins diminish. Intracellular lipid accumulation decreases as excess energy input stops.
The combined approach is most effective. Research shows that combining exercise with weight loss causes marked improvement in insulin sensitivity to a much greater degree than either intervention alone. This explains why the DPP combined weight loss and activity, rather than trying one or the other. Each mechanism addresses different defects simultaneously.
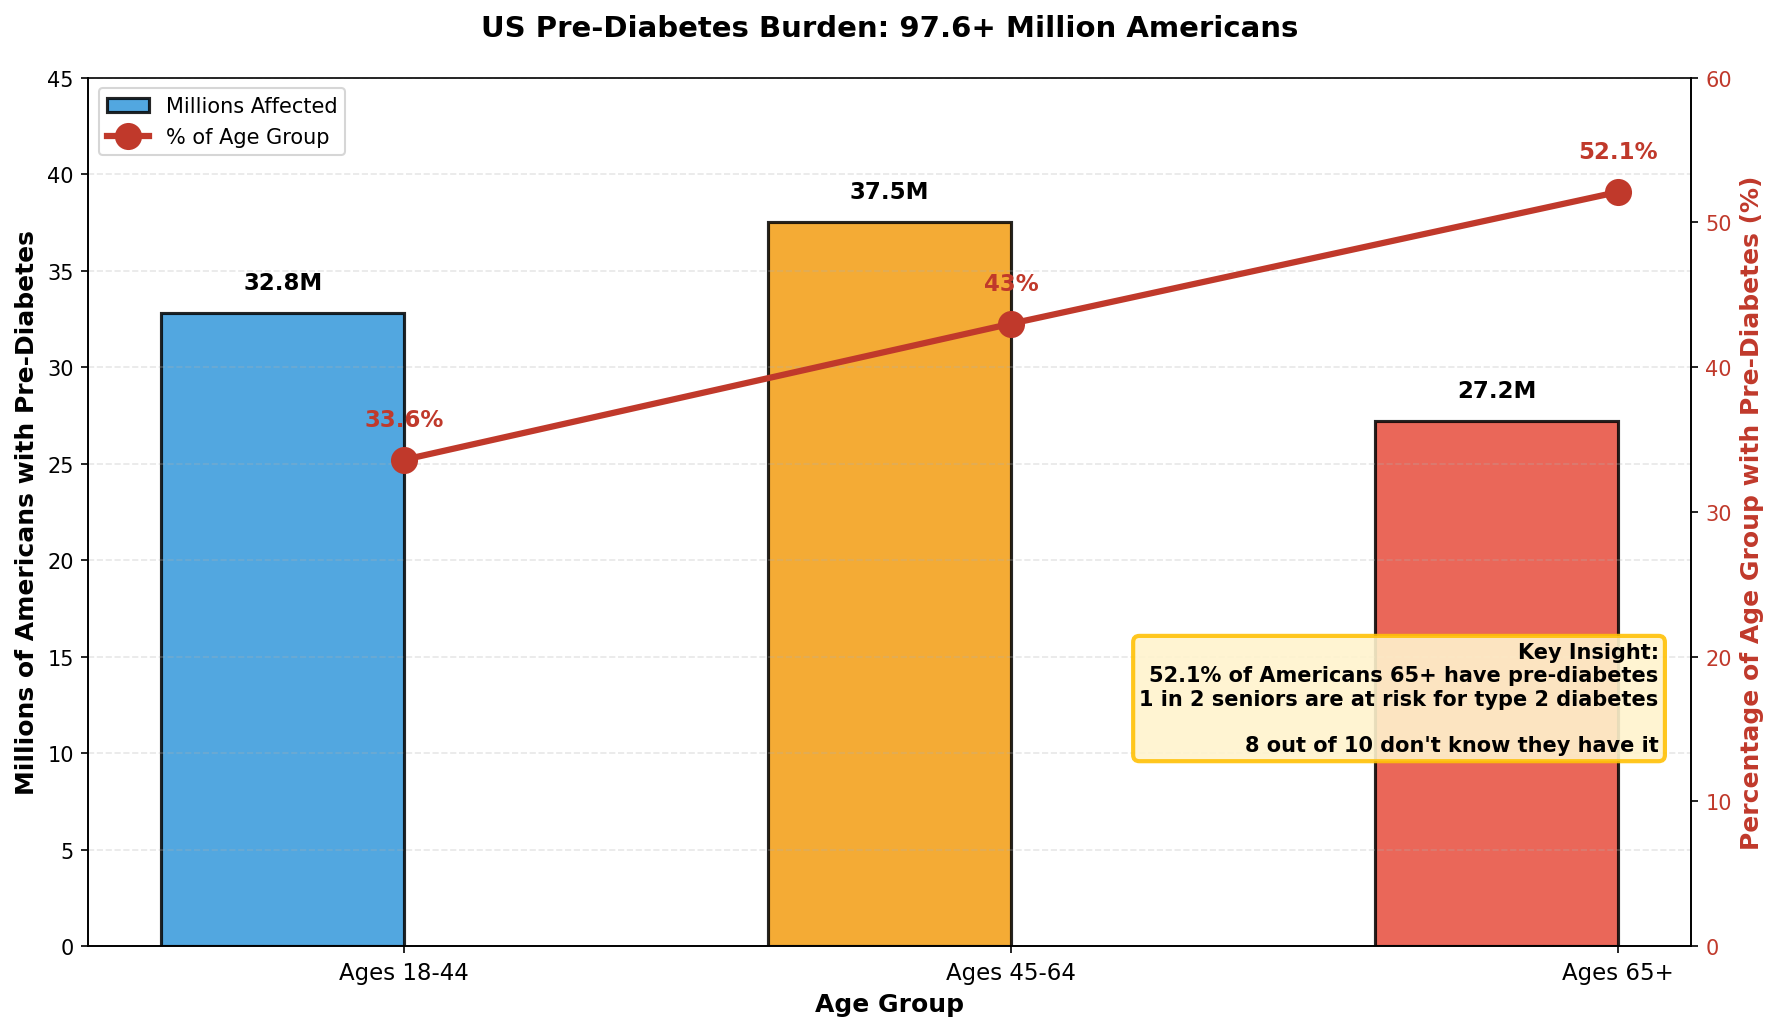 Figure 7: The multiple cellular mechanisms that drive insulin resistance progression, illustrating how different defects converge on reduced glucose entry.4
The Global and US Burden: Recognising the Scope
To appreciate the urgency of addressing insulin resistance, understanding its scale is crucial. 40% of young American adults aged 18 to 44 have insulin resistance, roughly 97 to 115 million Americans have pre-diabetes, representing 38% to 40% of all US adults. Of these, 80% to 81% don't know they have it, meaning approximately 77 to 92 million Americans are walking around with pre-diabetes without realising it.
Globally, the numbers are staggering. Impaired glucose tolerance affects 634.8 million adults worldwide (12.0% of the global adult population). Impaired fasting glucose affects 487.7 million adults worldwide (9.2%). Combined, over 1.1 billion adults globally have some form of glucose intolerance.
The regional distribution isn't uniform. Southeast Asia carries the highest impaired glucose tolerance burden. North America and the Caribbean have the highest impaired fasting glucose burden. By 2050, projections suggest 846.5 million adults (12.9% of the global population) will have impaired glucose tolerance. This represents continued growth despite awareness campaigns.
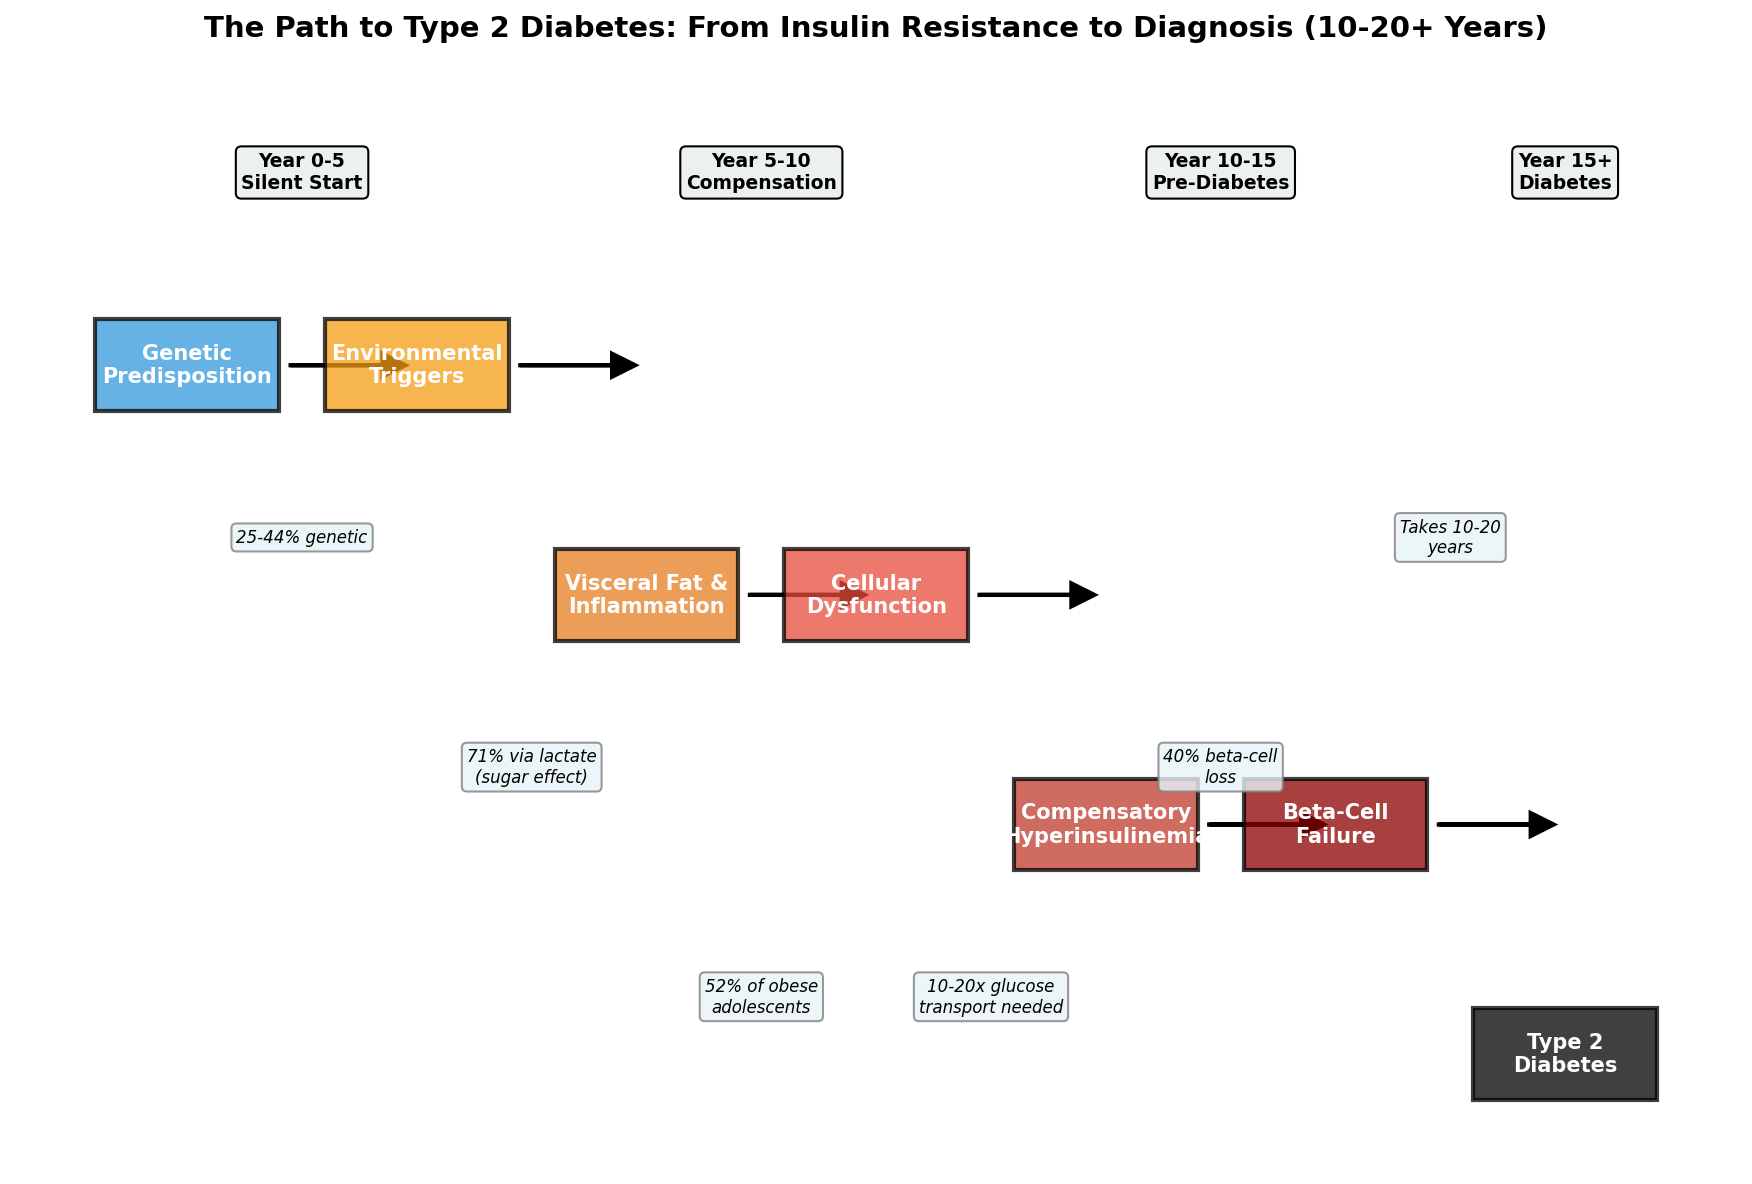 Figure 8: US population breakdown by age showing the distribution of pre-diabetes across age groups, illustrating that the problem affects both young and old.2
What You Can Actually Do: Evidence-Based Intervention
The evidence supports a clear intervention pathway. First, you need to know your numbers. Everyone age 45 and older should request screening. Anyone aged 18 to 44 with overweight or obesity, or other risk factors, should request screening. Anyone with family history of diabetes, personal history of gestational diabetes, PCOS (polycystic ovary syndrome), or cardiovascular disease should request screening. Request fasting glucose, HbA1c, and ideally fasting insulin and HOMA-IR calculation. You can't intervene in a problem you don't know you have.
Second, lifestyle intervention is first-line treatment. Based on the Diabetes Prevention Program evidence, the intervention is straightforward: achieve 7% body weight loss and 150 minutes per week of moderate-intensity physical activity (equivalent to brisk walking where you can talk but not sing).
For dietary intervention, create a moderate caloric deficit (approximately 500 calories below maintenance equals roughly 1 pound loss per week). Focus on low glycemic index carbohydrates: whole grains, legumes and non-starchy vegetables. Minimise refined carbs and added sugars. Aim for 25 to 30 grams or more of fibre daily (slows glucose absorption and improves satiety). Ensure adequate protein (approximately 1.2 to 1.6 grams per kilogramme of body weight) to support satiety and metabolic health. Emphasise unsaturated fats, minimise trans fats, moderate saturated fats. Minimise ultra-processed foods. Use smaller plates, eat slowly, track intake initially to build awareness. Proven dietary approaches include Mediterranean diet, DASH diet, low glycemic index diet, and plant-based diets.
For physical activity, aim for 150 minutes weekly of moderate-intensity activity like brisk walking, swimming, or cycling at a pace where you can talk but not sing. If currently sedentary, begin with what you can do and gradually increase. Add resistance or strength training 2 to 3 times weekly for added benefit. Even light activity breaks (5 to 10 minutes) that interrupt prolonged sitting provide benefits.
Third, if lifestyle intervention alone is insufficient, metformin is the only FDA-approved medication for preventing type 2 diabetes in people with pre-diabetes. From the DPP, metformin achieved a 31% risk reduction compared to placebo (less effective than lifestyle's 58% reduction but still valuable). Metformin works best in younger people and those with higher body mass index. It reduces hepatic (liver) glucose production and may improve insulin sensitivity slightly. Metformin is typically recommended when pre-diabetes is present with additional risk factors like obesity, family history, or metabolic syndrome or when lifestyle intervention alone hasn't achieved goals.
Fourth, ongoing monitoring and support matter. Initial intensive support should occur over 3 to 6 months for lifestyle establishment. Regular follow-up every 3 to 6 months is essential. Monitor fasting glucose, weight, dietary adherence, and physical activity level every 3 to 6 months. Monitor HbA1c and repeat full metabolic panel every 6 to 12 months. Track waist circumference, blood pressure, and symptoms continuously.
The Bottom Line: Your Time to Act is Now
Insulin resistance is not a condition that develops overnight, and it's not one that can't be reversed. It develops silently over 10 to 20 years, giving you a substantial window for intervention. Understanding how it develops (through visceral fat accumulation, inflammation, dietary toxins, lipid buildup inside cells, mitochondrial dysfunction, and endoplasmic reticulum stress) explains why lifestyle interventions work. Each intervention addresses multiple defects simultaneously.
The evidence from the Diabetes Prevention Program and recent 2024–2025 research is unequivocal: lifestyle intervention prevents or significantly delays type 2 diabetes. 58% of diabetes cases can be prevented through weight loss and physical activity. When pre-diabetes remission is achieved alongside weight loss, the prevention rate exceeds 76%.
The crucial facts for you:
- 40% of young American adults have insulin resistance, and most don't know it
- Insulin resistance develops silently for 10 to 20 years before diabetes diagnosis
- You have a substantial window to reverse it if you act early
- 7% weight loss plus 150 minutes weekly of physical activity reduces diabetes risk by 58%
- The metabolic damage is reversible if you intervene before beta-cell function is too severely compromised
- Advanced markers (fasting insulin, HOMA-IR) can show the problem years before standard pre-diabetes diagnosis
The path forward is clear: get screened, understand your numbers, and if insulin resistance or pre-diabetes is present, begin lifestyle intervention immediately. The Diabetes Prevention Program methodology is available through National DPP programmes in most communities, often covered by insurance. Individual coaching, structured curricula, and behavioural support make success more likely than trying to change independently.
Your future health depends on decisions you make now, when the damage is still reversible.
Further Reading
Understanding Glucose Metabolism and Insulin Physiology
- How Insulin and Blood Glucose Regulation Work - NCBI Bookshelf
- Insulin Signalling and GLUT4 Glucose Transporter - PMC/NIH
- Physiology of Normal Glucose Regulation - Colorado State University
Cellular Mechanisms of Insulin Resistance
- Cellular and Molecular Mechanisms of Insulin Resistance - Springer Nature
- Mechanisms for Insulin Resistance: Common Threads and Missing Links - Cell
- Insulin Resistance: From Mechanisms to Therapeutic Strategies - PMC
- Trends in Insulin Resistance: Insights into Mechanisms and Therapeutic Strategy - Nature
Visceral Fat and Inflammation
- Molecular Tracking of Insulin Resistance and Inflammation Development on Visceral Adipose Tissue - Frontiers
- What Causes the Insulin Resistance Underlying Obesity - PMC/NIH
- Metabolic Inflammation: Connecting Obesity and Insulin Resistance - Frontiers in Endocrinology
Dietary Factors and Sugar
- Both Sucrose and High Fructose Corn Syrup Linked to Increased Health Risks - UC Davis
- Consuming Sucrose- or HFCS-Sweetened Beverages Increases Hepatic Lipid - Oxford Academic
- The Impact of High Fructose Corn Syrup on Liver Injury - Frontiers in Nutrition
Mitochondrial Dysfunction
- Mitochondrial Bioenergetics Dysfunction in Type 2 Diabetes - Frontiers
- Role of Mitochondrial Dysfunction in Insulin Resistance - PMC/NIH
- Reducing the Mitochondrial Oxidative Burden Alleviates Lipid-Induced Muscle Insulin Resistance - Science Advances
Pre-Diabetes Diagnosis and Progression
- Prediabetes: A High-Risk State for Developing Diabetes - PMC/NIH
- Diagnosis and Classification of Diabetes: Standards of Care in Diabetes 2025-2026 - ADA
- Global and Regional Prediabetes Prevalence: Updates for 2024 and Projections for 2050 - ADA
Reversibility and Prevention Evidence
- Reduction in the Incidence of Type 2 Diabetes with Lifestyle Intervention or Metformin - NEJM
- Prevention of Type 2 Diabetes Through Prediabetes Remission Without Weight Loss - Nature Medicine
- Type 2 Diabetes Remission: A New Mission in Diabetes Care - ADA
- National Diabetes Prevention Program - CDC
Genetic Risk and Family History
- Genetics of Insulin Resistance and the Metabolic Syndrome - PMC/NIH
- Type 2 Diabetes: MedlinePlus Genetics
- Genetic Syndromes of Severe Insulin Resistance - Oxford Academic
Lifestyle Intervention and Exercise
- Exercise as 'Precision Medicine' for Insulin Resistance - BMC Sports Science
- Update on the Effects of Physical Activity on Insulin Sensitivity - PMC/NIH
- Weight Loss and Exercise Differentially Affect Insulin Sensitivity - PubMed
References/Helpful Resources
- Defining and Characterising the Progression of Type 2 Diabetes. PMC/NIH. https://pmc.ncbi.nlm.nih.gov/articles/PMC2811457/
- Global and Regional Prediabetes Prevalence: Updates for 2024 and Projections for 2050. American Diabetes Association. 2024;48(11):e142. https://diabetesjournals.org/care/article/48/11/e142/163407/
- Physiology, Glucose Metabolism. NCBI Bookshelf. https://www.ncbi.nlm.nih.gov/books/NBK560599/
- Trends in Insulin Resistance: Insights into Mechanisms and Therapeutic Strategy. Nature Reviews. 2022;23(5):341-356. https://www.nature.com/articles/s41392-022-01073-0
- Molecular Tracking of Insulin Resistance and Inflammation Development on Visceral Adipose Tissue. Frontiers in Immunology. 2023;14:1014778. https://www.frontiersin.org/journals/immunology/articles/10.3389/fimmu.2023.1014778/full
- Consuming Sucrose- or HFCS-Sweetened Beverages Increases Hepatic Lipid. Journal of Clinical Endocrinology and Metabolism. 2021;106(11):3248-3260. https://academic.oup.com/jcem/article/106/11/3248/6321747
- Prediabetes: A High-Risk State for Developing Diabetes. PMC/NIH. 2013. https://pmc.ncbi.nlm.nih.gov/articles/PMC3891203/
- Genetics of Insulin Resistance and the Metabolic Syndrome. PMC/NIH. 2016. https://pmc.ncbi.nlm.nih.gov/articles/PMC4911377/
- Reduction in the Incidence of Type 2 Diabetes with Lifestyle Intervention or Metformin. New England Journal of Medicine. 2002;346(6):393-403. https://www.nejm.org/doi/full/10.1056/NEJMoa012512
- Risk of Progression to Diabetes Among Older Adults. JAMA Internal Medicine. 2020;180(10):1345-1354. https://jamanetwork.com/journals/jamainternalmedicine/fullarticle/2775594
